The new Retool timeline component
Retool introduced a new Timeline component, a time-based visualization tool for displaying tasks or activities in a Gantt-like chart. This feature is useful for adding a new level of visual clarity to your Retool applications, especially when dealing with tasks that span over time.
Key features #
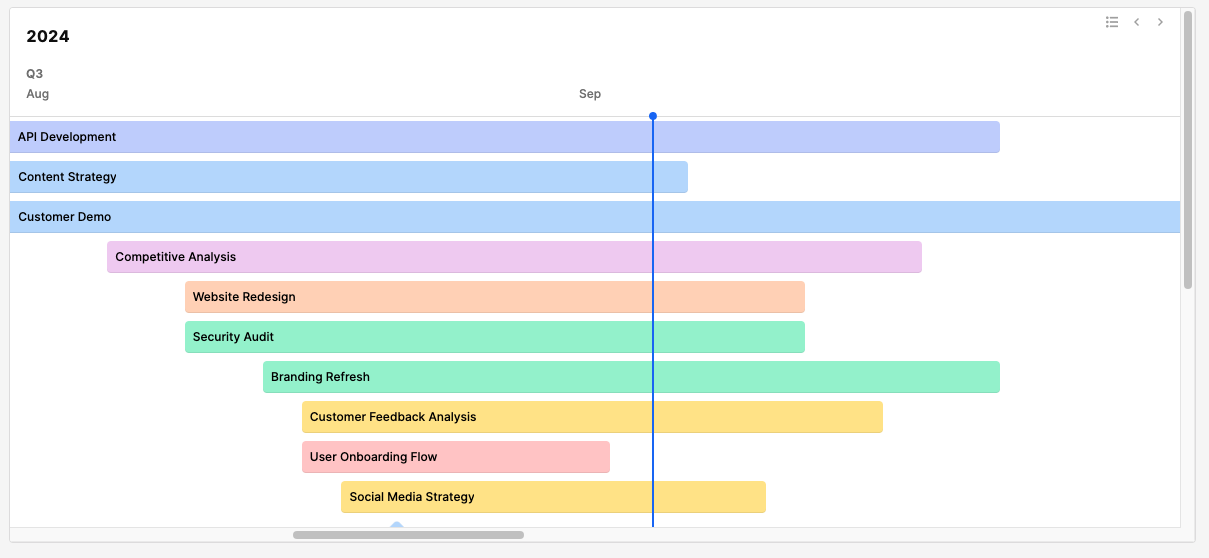
The Timeline component allows you to create bars that represent different activities or tasks. Each bar comes with labels, so it’s easy to identify tasks at a glance. You can also color-code these bars to make the chart visually appealing and organized.
Here are a few things to love about this new addition:
- Simple: The component may not have all the bells and whistles of fully specialized project management tools, but that’s part of its appeal. It’s light, easy to use, and can seamlessly fit into your Retool app to offer a quick overview of time-based activities.
- Grouping and hierarchies: One of the best aspects is that the Timeline component supports grouping based on properties, allowing you to create hierarchical visualizations. This is especially handy when managing a large number of tasks, as you can cluster related activities together for a cleaner overview.
Use cases #
The Timeline component can be useful in several scenarios. Here are a few ideas:
- Project Tracking: Keep track of different tasks, their timelines, and completion status. Even though it’s not as feature-rich as tools like Jira or Trello, it’s a great option for light project management or internal apps.
- Resource Management: Visualize how team members are allocated across various tasks over time. This could be particularly useful for managing multiple projects or deadlines.
- Data Processing Pipelines: When building a more complex Retool app that involves multiple steps or stages over time, the Timeline component can help provide a high-level overview of progress.
What you can do #
-
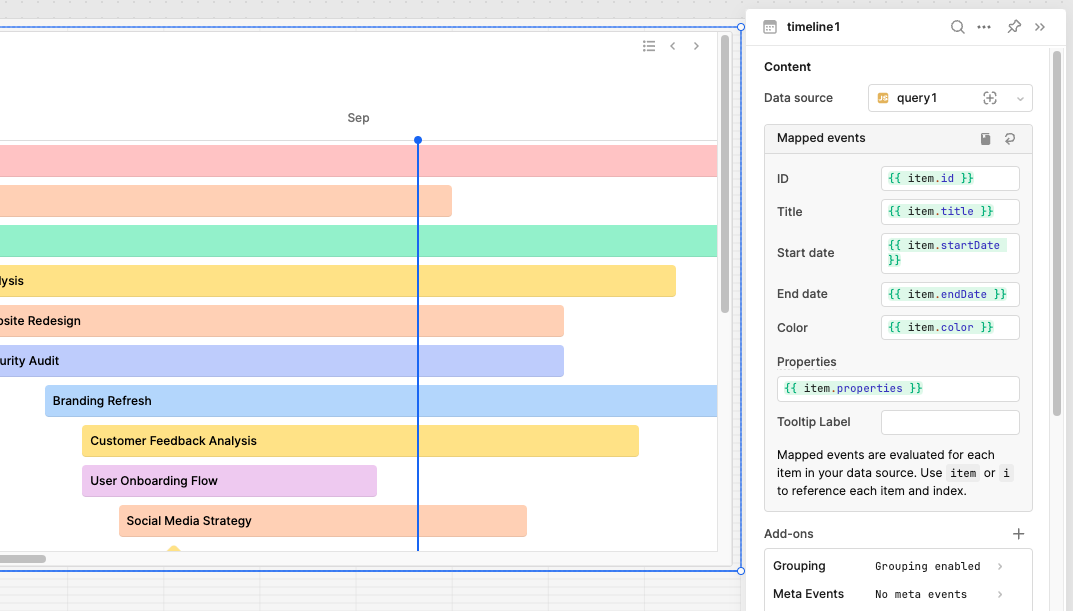
Data-Driven: As with all Retool components, the Timeline is powered by your data sources. Simply map the relevant properties to display events as desired.
-
Easy configuration: It’s minimalistic yet fully functional out of the box, making it extremely easy to set up. All you need to do is connect your data and adjust a few settings.
-
Interactive scrolling: The component allows users to pan the viewport, scrolling both horizontally and vertically to explore different events. This provides a flexible and interactive user experience.
-
Deadline markers: You can add markers to highlight deadlines or important milestones, adding more context to the timeline.
Let’s make an example #
Since the component is data-driven, any changes to the data source will automatically update the representation, ensuring real-time adaptability. This approach provides flexibility, allowing for the seamless integration of additional controllers or interfaces when interaction or customization is required. As the underlying data evolves, so does the system’s ability to reflect those changes dynamically.
Here you can see an example with a selector to filter out specific bars, based on some properties:
Filter a table to filter the timeline side by side #
One possibility is having a table that is a specific view of the data source and use the builtin filter to filter also the timeline sa well.
We need to use as data source for the timeline the displayed table data, using the method getDisplayedData of the table.
Limitations #
The click handler, so far, is very basic and hardly useful. It’s a click on the whole component, so clicking on a specific bar has the same effect as clicking on any other part of the component.
Plus, there is no selected bar functionality.
We hope they’ll add those, as they usually do for other components.
When use it? #
While the Timeline component won’t replace specialized project management software, it’s a good addition for teams that already use Retool to build internal tools. If you’re building something more elaborate and want a visual way to track progress over time, the Timeline component integrates smoothly and gives your users an intuitive way to understand what’s happening.